
免責聲明:
任何投資行為均有其風險,作為一名投資者,應為自己任何投資決策行為承擔所有風險。
本網站當盡力提供正確之資訊,所載資料均來自或本諸我們相信可靠之來源,但對其完整性、即時性和正確性不做任何擔保,如有錯誤或疏漏,本網站所有人及關係人,並不負任何法律責任。
本文非任何形式之投資建議,不保證所提供之資訊可以創造獲利、減少投資損失,亦不會鼓吹任何具體之投資行動。本網站所有人及關係人,對於本網站資訊使用者直接或間接依賴並參考相關資訊後,採取任何投資行為所導致之直接或間接損失,或因此產生之一切責任,均不負任何損害賠償及其他法律上之責任。
任何投資行為均有其風險,作為一名投資者,應為自己任何投資決策行為承擔所有風險。
本網站當盡力提供正確之資訊,所載資料均來自或本諸我們相信可靠之來源,但對其完整性、即時性和正確性不做任何擔保,如有錯誤或疏漏,本網站所有人及關係人,並不負任何法律責任。
本文非任何形式之投資建議,不保證所提供之資訊可以創造獲利、減少投資損失,亦不會鼓吹任何具體之投資行動。本網站所有人及關係人,對於本網站資訊使用者直接或間接依賴並參考相關資訊後,採取任何投資行為所導致之直接或間接損失,或因此產生之一切責任,均不負任何損害賠償及其他法律上之責任。


前言
英美菸草是英國的跨國菸草公司。
基本資料
- 美股代號:
BTI - 產業別:必需消費品
- 工業別:菸草製造
- 巿值:753.90 億英鎊
- 與 S&P 500 相比的 beta 值:0.44
- 殖利率:7.71%。採季配息
- 官方網站
核心業務
英美菸草的業務如下:
- 非燃菸草 (non-combustibles)
- 電子菸 (vapour)
- 加熱菸 (tobacco heating)
- 現代口服製品 (modern oral)
- 傳統口服製品 (traditional oral)
- 傳統菸草 (combustible tobacco)
傳統菸草對身體有許多負面影響,這些影響來自於尼古丁 (nicotine)、焦油 (tar) 等物質。現在該公司推廣減害商品,即非燃菸草。不過,菸草會受到各地法規影響,不一定會在巿場上看到。
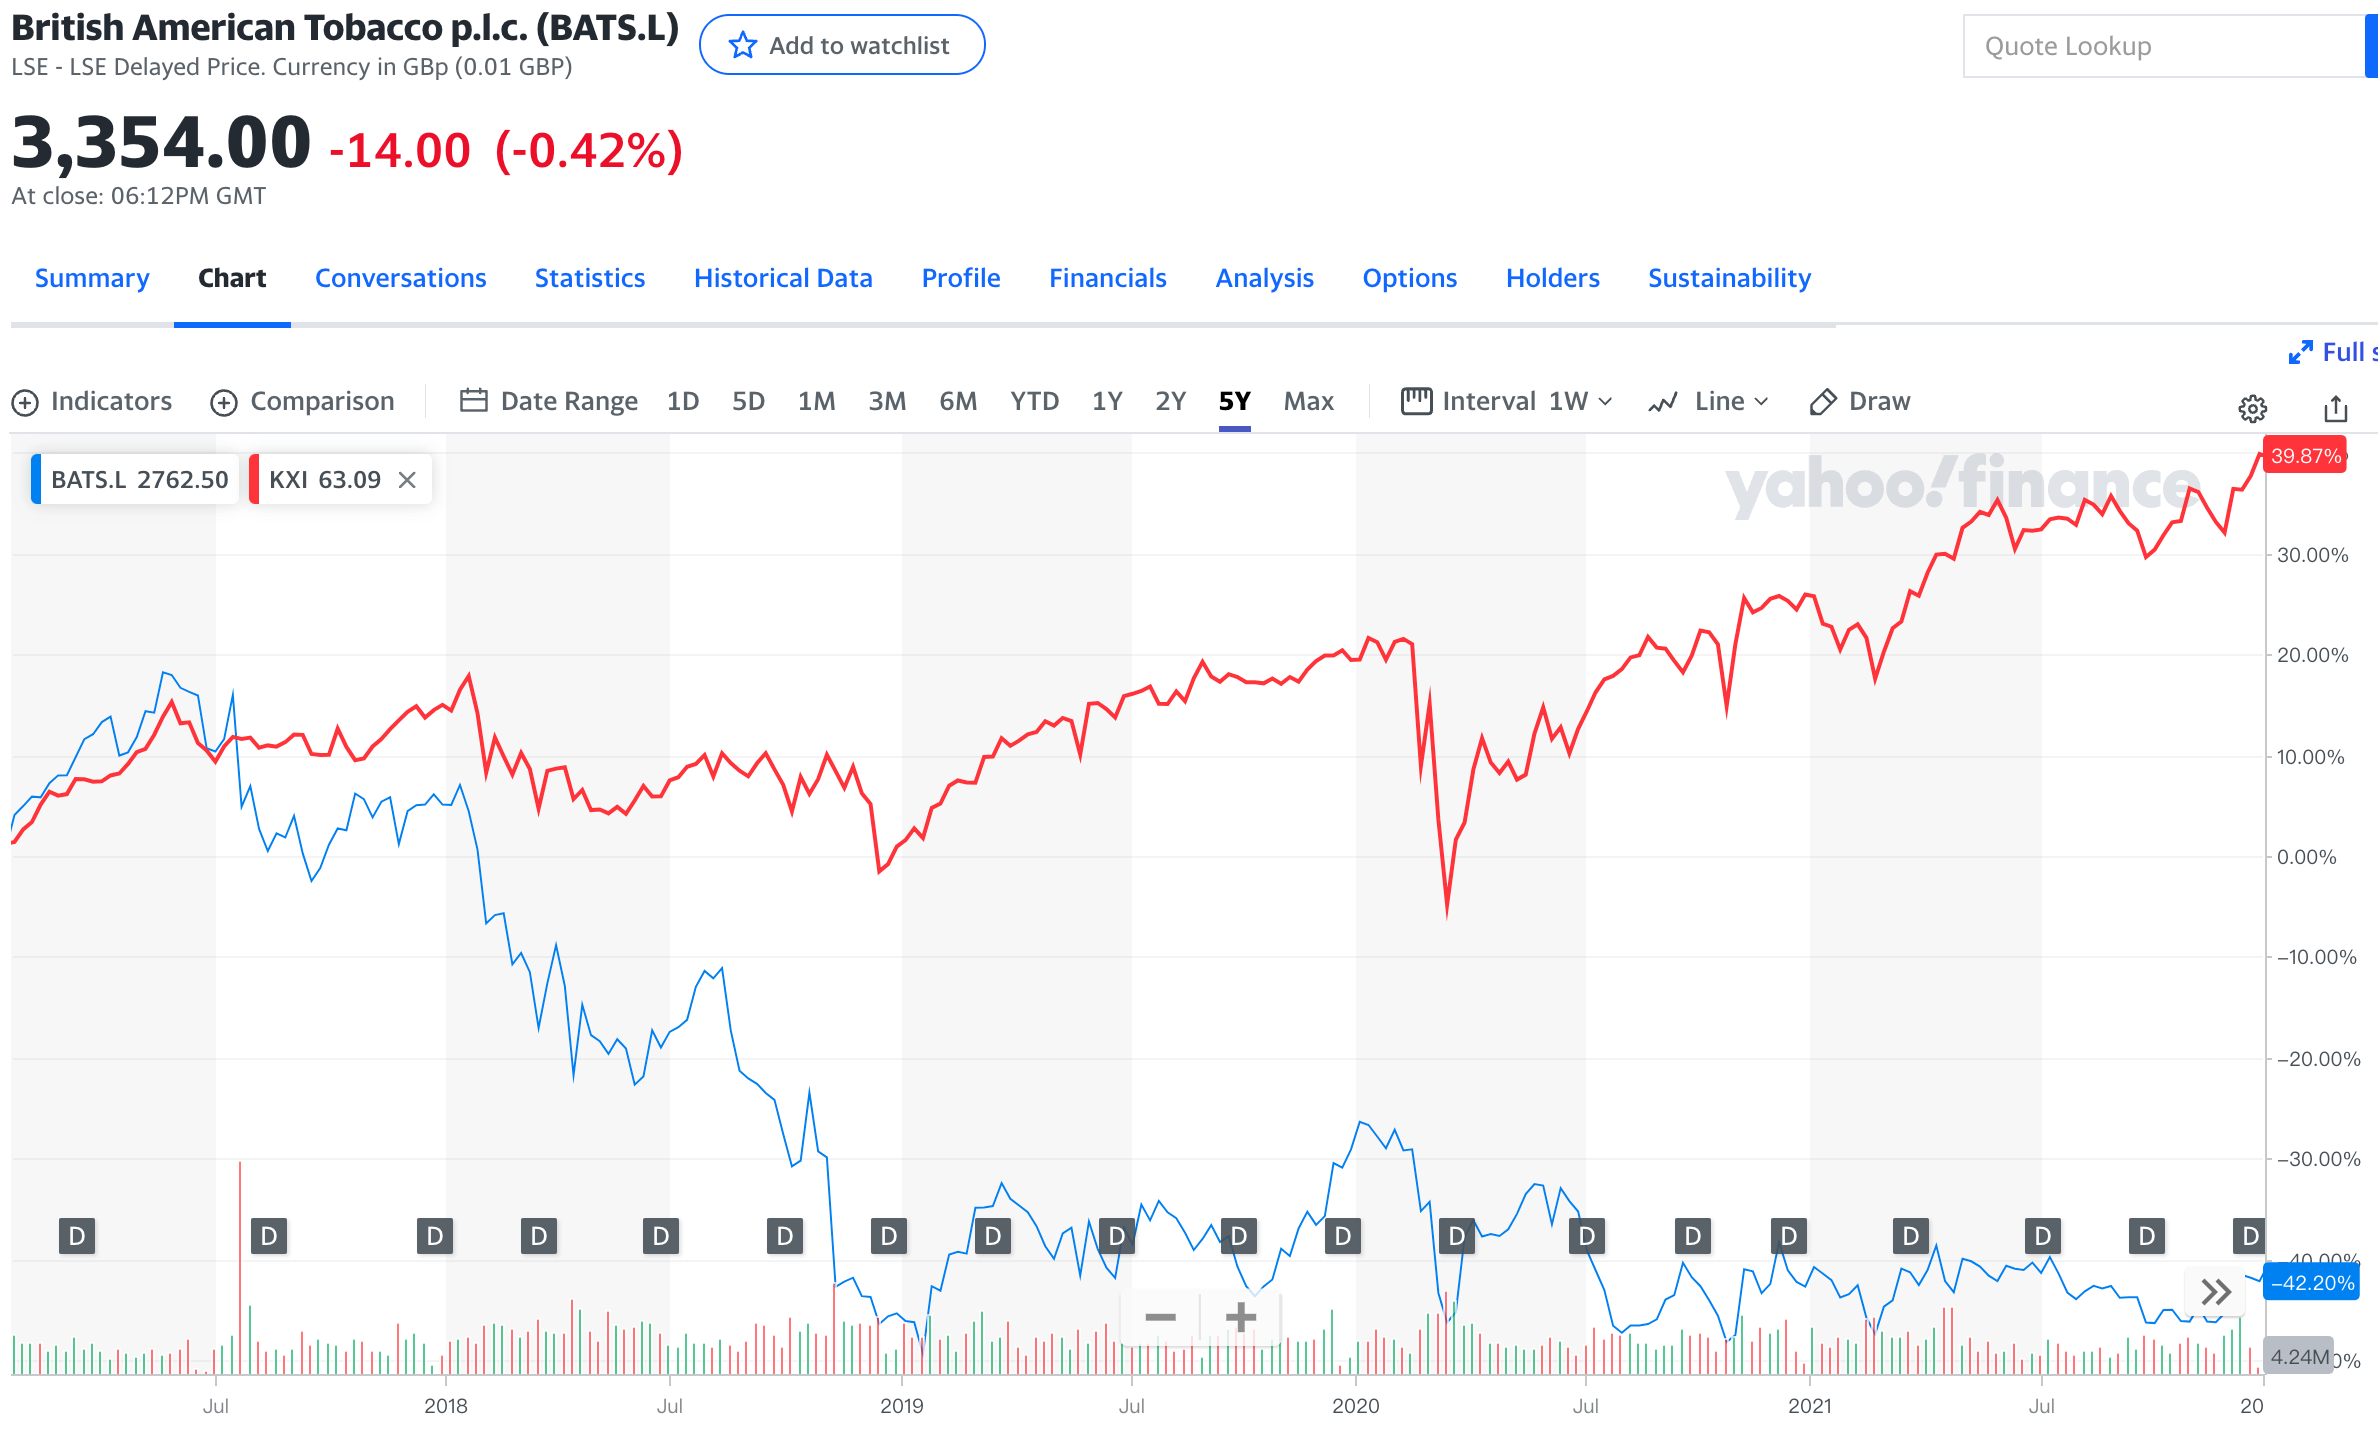
股價變化
營運狀況
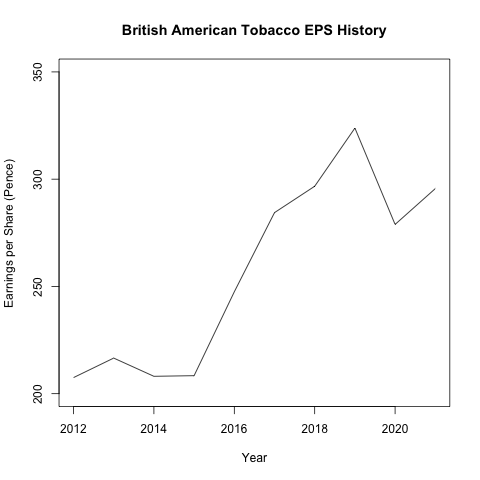
以下是英美菸草在近十年的 diluted EPS:
| 年份 | EPS | 註 |
|---|---|---|
2012 |
207.5 |
|
2013 |
216.6 |
|
2014 |
208.1 |
|
2015 |
208.4 |
|
2016 |
247.5 |
|
2017 |
284.4 |
|
2018 |
296.7 |
貿易戰 |
2019 |
323.8 |
新冠肺炎 |
2020 |
278.9 |
金融恐慌 |
2021 |
295.6 |
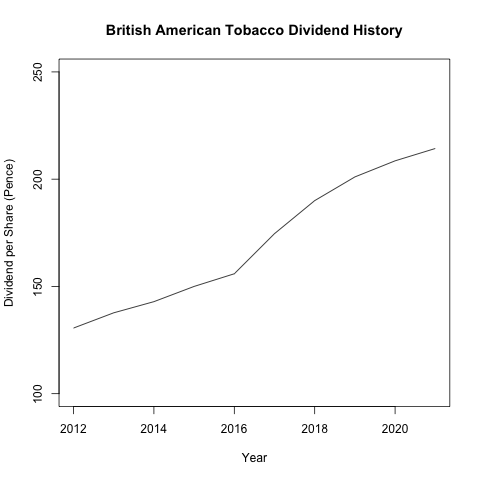
股利政策
以下是英美菸草在近十年的股利政策:
| 年份 | 每股股利 | 價格 | 殖利率 | 註 |
|---|---|---|---|---|
2012 |
88.4+42.2 |
3121.0 |
4.18% |
|
2013 |
92.7+45.0 |
3238.0 |
4.25% |
|
2014 |
97.4+45.5 |
3500.0 |
4.08% |
|
2015 |
100.6+49.4 |
3771.0 |
3.97% |
|
2016 |
104.6+51.3 |
4621.5 |
3.37% |
|
2017 |
118.1+56.5 |
5018.0 |
3.47% |
|
2018 |
43.6+48.8+48.8+48.8 |
2500.0 |
7.60% |
貿易戰 |
2019 |
48.8+50.75+50.75+50.75 |
3231.5 |
6.22% |
新冠肺炎 |
2020 |
50.75+52.6+52.6+52.6 |
2708.0 |
7.70% |
金融恐慌 |
2021 |
52.6+53.9+53.9+53.9 |
2729.5 |
7.85% |
價格是以每年的最後一個交易日的收盤價為準,不考慮賣出。
如何投資
- 英股:
BATS - 美股:
BTI
相關的 R 命令稿
EPS 直線圖
# Set the x axis.
years <- c("2012", "2013", "2014", "2015", "2016", "2017",
           "2018", "2019", "2020", "2021")
# Set the y axis.
eps <- c(207.5, 216.6, 208.1, 208.4, 247.5, 284.4, 296.7,
         323.8, 278.9, 295.6)
# Save to a PNG file.
png("British-American-Tobacco-EPS-history-2021.png")
# Plot the line chart.
plot(years, eps, type="l", ylim=c(200, 350),
     xlab="Year", ylab="Earnings per Share (Pence)",
     main="British American Tobacco EPS History")
# Close the device.
dev.off()
$ Rscript British-American-Tobacco-EPS-2021.R股利政策直線圖
# Set the x axis.
years <- c("2012", "2013", "2014", "2015", "2016", "2017",
           "2018", "2019", "2020", "2021")
# Set the y axis.
dividends <- c((88.4+42.2), (92.7+45.0), (97.4+45.5),
               (100.6+49.4), (104.6+51.3), (118.1+56.5),
               (43.6+48.8+48.8+48.8),
               (48.8+50.75+50.75+50.75),
               (50.75+52.6+52.6+52.6),
               (52.6+53.9+53.9+53.9))
# Save to a PNG file
png("British-American-Tobacco-dividend-history-2021.png")
# Plot the line chart.
plot(years, dividends, type="l", ylim=c(100, 250),
     xlab="Year", ylab="Dividend per Share (Pence)",
     main="British American Tobacco Dividend History")
# Close the device.
dev.off()
$ Rscript British-American-Tobacco-dividend-2021.R