
任何投資行為均有其風險,作為一名投資者,應為自己任何投資決策行為承擔所有風險。
本網站當盡力提供正確之資訊,所載資料均來自或本諸我們相信可靠之來源,但對其完整性、即時性和正確性不做任何擔保,如有錯誤或疏漏,本網站所有人及關係人,並不負任何法律責任。
本文非任何形式之投資建議,不保證所提供之資訊可以創造獲利、減少投資損失,亦不會鼓吹任何具體之投資行動。本網站所有人及關係人,對於本網站資訊使用者直接或間接依賴並參考相關資訊後,採取任何投資行為所導致之直接或間接損失,或因此產生之一切責任,均不負任何損害賠償及其他法律上之責任。


前言
葛蘭素史克是英國的製藥公司。該公司已經在西元 2022 年七月拆成 GSK 和 Haleon 兩家公司。前者專注在處方藥及疫苗,後者則專注在非處方藥。本文介紹 GSK,日後有機會再另開文章介紹 Haleon。
基本資料
- 英股代號:
GSK - 產業別:健康照護
- 工業別:藥物製造
- 巿值:575.21 億英鎊
- 和 S&P 500 相比的 beta 值:0.29
- 殖利率:6.75%。採季配息
- 官方網站
核心業務
拆分前的 GSK 有三大項業務:
- 處方藥 (medicine)
- 感染疾病 (infectious disease):新冠肺炎用藥 (sotrovimab) 及其他感染疾病
- HIV:長效注射針劑 (Cabenuva)
- 腫瘤學 (oncology):多發性骨髓瘤 (multiple myeloma) 用藥、子宫内膜癌 (endometrial cancer) 用藥、卵巢癌 (ovarian cancer) 用藥及其他腫瘤
- 免疫學 (immunology):紅班性狼瘡 (systemic lupus erythematosus) 用藥、類風濕性關節炎 (rheumatoid arthritis) 用藥
- 疫苗 (vaccine)
- 感染疾病:帶狀皰疹 (shingles) 疫苗、人類呼吸道合胞病毒 (respiratory syncytial virus) 疫苗 (註) 、腦膜炎 (meningitis) 疫苗
- 非處方藥 (consumer healthcare product)
- 口腔健康 (oral health):舒酸定 (Sensodyne)、牙周適 (Parodontax)
- 呼吸道用藥 (respiratory drug)
- 止痛藥 (pain relief):普拿疼 (Panadol)
- 維他命 (vitamin)、礦物質 (mineral)、營養補充品 (supplement):善存 (Centrum)
前兩者合計約占七成營收,後者則占三成。
非處方藥僅列出幾個在台灣常見的品項。
(註) 臨床試驗中
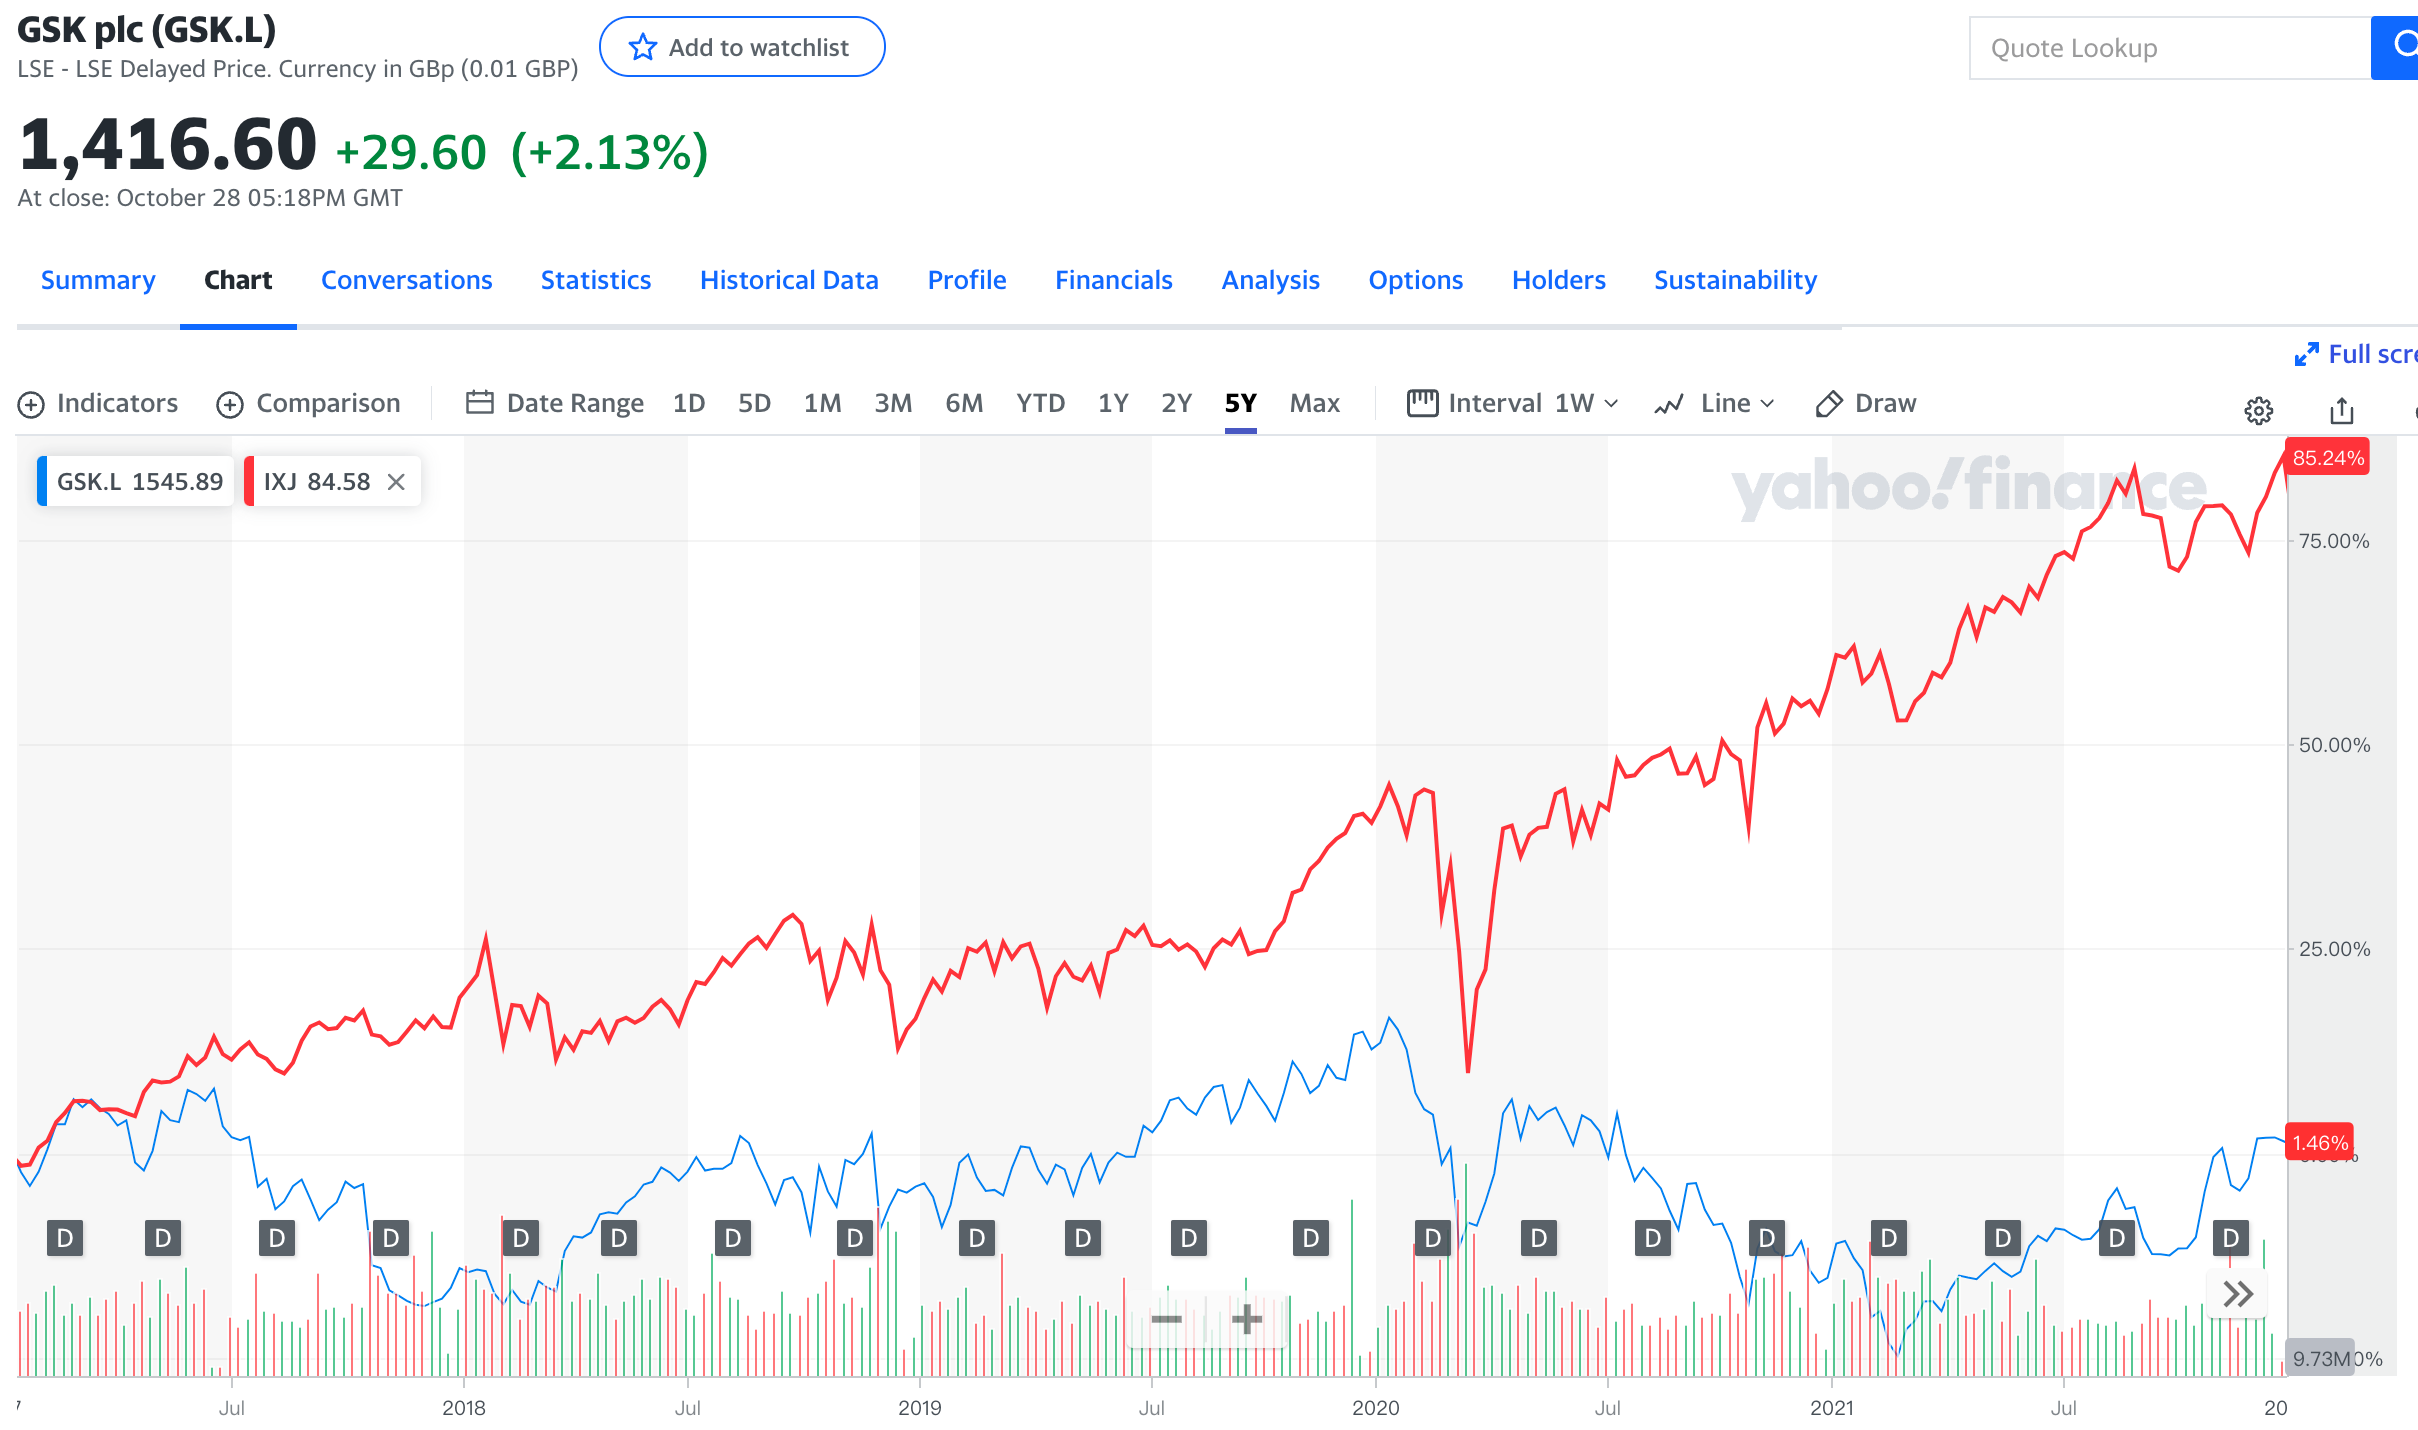
股價變化
營運狀況
以下是 GSK 在拆分前的 EPS:
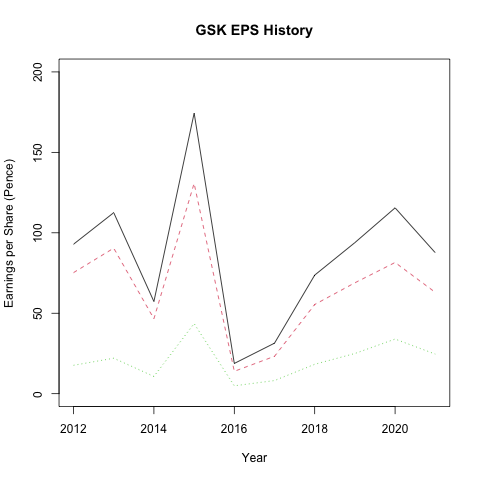
由於 GSK 已經拆分為兩家公司。除了列出該公司在未拆分時的 EPS 外,這裡也列出不同項目的 EPS。
| 年份 | EPS | 處方藥及疫苗 | 非處方藥 | 註 |
|---|---|---|---|---|
2012 |
92.9 |
81% |
19% |
|
2013 |
112.5 |
80.4% |
19.6% |
|
2014 |
57.3 |
81.3% |
18.7% |
|
2015 |
174.3 |
75% |
25% |
交易收入 |
2016 |
18.8 |
74% |
26% |
|
2017 |
31.4 |
74% |
26% |
|
2018 |
73.7 |
75.2% |
24.8% |
貿易戰 |
2019 |
93.9 |
73.4% |
26.6% |
新冠肺炎 |
2020 |
115.5 |
70.6% |
29.4% |
金融恐慌 |
2021 |
87.6 |
71.9% |
28.1% |
西元 2015 年的 EPS 受到 GSK 和 Novartis 的交易案影響 (出處),非其真實收入。
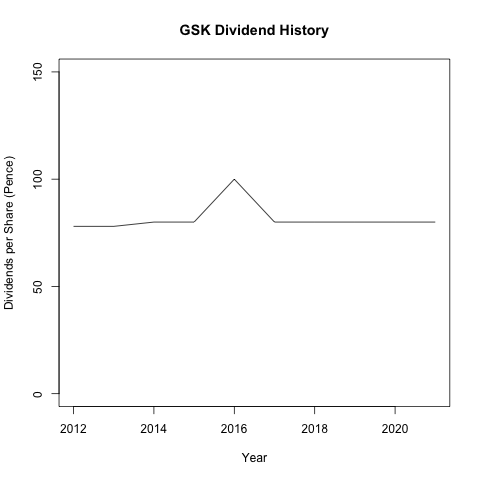
股利政策
以下是 GSK 在拆分前的股利政策:
| 年份 | 股利政策 | 價格 | 殖利率 | 註 |
|---|---|---|---|---|
2012 |
21+5+17+17+18 |
1344.82 |
5.80% |
|
2013 |
22+18+19+19 |
1623.36 |
4.80% |
|
2014 |
23+19+19+19 |
1386.12 |
5.77% |
|
2015 |
23+19+19+19 |
1383.10 |
5.78% |
交易收入 |
2016 |
23+20+19+19+19 |
1573.49 |
6.35% |
|
2017 |
23+19+19+19 |
1332.23 |
6.00% |
|
2018 |
23+19+19+19 |
1502.17 |
5.32% |
貿易戰 |
2019 |
23+19+19+19 |
1792.09 |
4.46% |
新冠肺炎 |
2020 |
23+19+19+19 |
1351.87 |
5.91% |
金融恐慌 |
2021 |
23+19+19+19 |
1629.90 |
4.90% |
股利和價格的計價單位是便士 (pence),即 0.01 英鎊。價格以每年的最後一個交易日為準,不考慮賣出。
如何投資
- 英股:
GSK - 美股:
GSK
相關的 R 命令稿
EPS 直線圖
# Set the x axis.
years <- c("2012", "2013", "2014", "2015", "2016", "2017",
           "2018", "2019", "2020", "2021")
# Set the y axis.
eps <- c(92.9, 112.5, 57.3, 174.3, 18.8, 31.4, 73.7, 93.9,
         115.5, 87.6)
eps_med <- c(92.9 * 0.81, 112.5 * 0.804, 57.3 * 0.813,
             174.3 * 0.75, 18.8 * 0.74, 31.4 * 0.74,
             73.7 * 0.752, 93.9 * 0.734, 115.5 * 0.706,
             87.6 * 0.719)
eps_otc <- c(92.9 * 0.19, 112.5 * 0.196, 57.3 * 0.187,
             174.3 * 0.25, 18.8 * 0.26, 31.4 * 0.26,
             73.7 * 0.248, 93.9 * 0.266, 115.5 * 0.294,
             87.6 * 0.281)
# Save to a PNG file.
png("GSK-EPS-history-2021.png")
# Plot the line chart.
matplot(matrix(c(years, years, years),
               nrow=length(years), byrow=FALSE),
        matrix(c(eps, eps_med, eps_otc),
               nrow=length(years), byrow=FALSE),
        type="l", ylim=c(0, 200),
        xlab="Year", ylab="Earnings per Share (Pence)",
        main="GSK EPS History")
# Close the device.
dev.off()
$ Rscript GSK-EPS-2021.R股利政策直線圖
# Set the x axis.
years <- c("2012", "2013", "2014", "2015", "2016", "2017",
           "2018", "2019", "2020", "2021")
# Set the y axis.
dividends <- c(c(21+5+17+17+18), c(22+18+19+19),
               c(23+19+19+19), c(23+19+19+19),
               c(23+20+19+19+19), c(23+19+19+19),
               c(23+19+19+19), c(23+19+19+19),
               c(23+19+19+19), c(23+19+19+19))
# Save to a PNG file.
png("GSK-dividend-history-2021.png")
# Plot the line chart.
plot(years, dividends, type="l", ylim=c(0, 150),
     xlab="Year", ylab="Dividends per Share (Pence)",
     main="GSK Dividend History")
# Close the device.
dev.off()
$ Rscript GSK-dividend-2021.R